Brighton & Hove Albion

Brighton & Hove Albion won after full-time.
2 - 1
FT
Nottingham Forest

Brighton & Hove Albion won after full-time.
2 - 1
FT
1
46%
Brighton & Hove Albion
2.10
X
27%
Draw
3.40
2
27%
Nottingham Forest
3.53
Predictability
-1.10
Log loss
MediumMedian odds aggregated from available pre-match books.
Head-to-head
Head-to-head
Head-to-head
Head-to-head
Head-to-head
Head-to-head
Home
42%
Draw
26%
Away
32%
Goals/game
2.8
Over 2.5
56%
BTTS
57%
Goalless
6%
Peak Scoring Window
75-90 (24.2%)
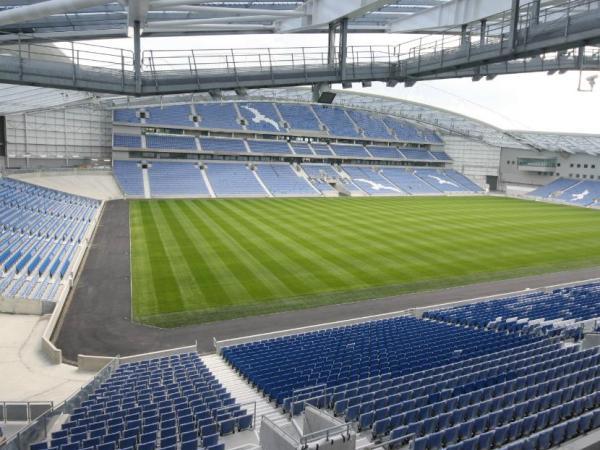
Falmer
Capacity 31,876
Surface Grass
Brighton & Hove Albion
50%
Draw
25%
Nottingham Forest
25%
Avg goals
4.0
BTTS
50%
Based on 4 finished meetings.